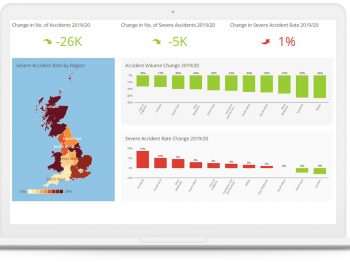
A new intuitive online dashboard has launched to help fleets drill down into official accident data and assess the key influences on road safety.

The Teletrac Navman UK Road Safety Dashboard uses the figures from the annual Department for Transport ‘Reported Road Casualties in Great Britain’ analysis and showcases the data in an easily digestible format, enabling fleet operators to review the data easily and quickly.
The figures, which capture all personal injury, accident and casualty statistics on public roads across the nation throughout 2020, can be broken down to examine granular details, such as lighting and road conditions, level of speed and time of day, as factors in road accidents.
Users can also filter on vehicle type and season, helping them to become more informed about how to adjust driving behaviour based on road conditions.
The dashboard also provides a useful summary of accidents across UK regions for 2020. For example, Scotland had the highest severe accident rate (37%) for heavy and light commercial vehicles. In comparison, London saw the largest drop in severe accident rate (6%), with Wales, East Midlands, North East and Yorkshire & the Humber also declining. The analysis also revealed that the severe accident rate is highest on single carriageway roads (24%) and 60mph speed roads (29%).
Peter Millichap, marketing director at Teletrac Navman UK, said: “Over the last year, commercial fleets have experienced a significant uplift in activity. This has totally reshaped today’s commercial fleet industry and the way they work. However, now more than ever it is vital to ensure that safety of fleets and other road users stays top of the agenda.
“The dashboard we have developed provides an easy-to-read and convenient way to digest this critical information. As data specialists, we thrive on turning data into actionable insights so that fleet operators can make fast decisions to improve their businesses and the industry as a whole. We believe that post-pandemic monitoring could be the key to improving the safety of all road users now and in the future.”
In addition to maximising the data from the dashboard, commercial operators running telematics are able to use real-time data at a granular level, in order to set meaningful KPIs for their teams and manage risk. Similarly, drivers’ hours and levels of fatigue recorded via a tachograph system can be used to gain a good understanding of driver safety and wellbeing, while vehicle cameras can provide additional evidence of behaviour.
To visit the new dashboard, click here.

