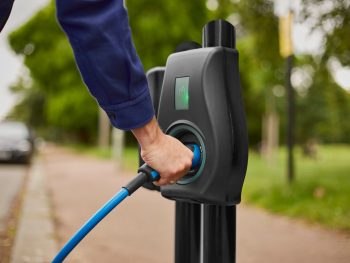
A list of the UK’s local authorities most in need of kerbside charging to help company van drivers go electric is now out.

Published by the Association of Fleet Professionals (AFP), it’s headed up by Birmingham City Council, followed by City of Edinburgh Council, London Borough of Croydon Council, Glasgow City Council and the London Borough of Newham.
The findings are based on the AFP’s new national kerbside charging map and could help fleets accelerate charge point deployment – in turn, driving EV take-up.
Unveiled last month, the charging map uncovers – for the first time – exactly where UK businesses need kerbside charging to be installed close to the homes of their van-driving employees.
According to the AFP, around 60-70% of fleet van drivers need kerbside charging installed in order to use an electric van – and it’s working to ensure that each of them will have facilities installed within a safe 4-5 minute walk.
Its new charging map, aggregated to a level of the UK’s 408 local authorities and based on the the number of drivers in each area who need kerbside charging, provides fleets with hard data that allows them to approach partners such as local authorities and charging providers, and show exactly where chargers need to be sited.
Paul Hollick, AFP chair, said the requirement for kerbside charging remained the single biggest obstacle to the adoption of electric vans for businesses – and added that the new map was a crucial step forward.
“These new rankings are a good indication of the places where most work needs to be done. What they have in common is that these are heavily populated, urban areas where there is a large proportion of homes without driveways such as terraced houses and apartments.”
Hollick added that the AFP was very keen for more fleets to add their van driver data to ensure they are represented.
He said: “This data is, of course, anonymised and handled in accordance with all relevant regulations. Details are available on our website or by e-mailing us.”
A summary of the map is available from the AFP website while a detailed version can be obtained by e-mailing [email protected].
The rankings in full are:
- Birmingham City Council
- City of Edinburgh Council
- London Borough of Croydon
- Glasgow City Council
- London Borough of Newham
- Leeds City Council
- London Borough of Enfield
- Bristol City Council
- Buckinghamshire Council
- Wiltshire Council
- London Borough of Lewisham
- London Borough of Waltham Forest
- London Borough of Greenwich
- London Borough of Southwark
- London Borough of Haringey
- London Borough of Haringey
- Medway Council
- Plymouth City Council
- Liverpool City Council
- Portsmouth City Council

