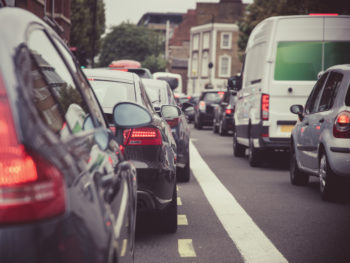
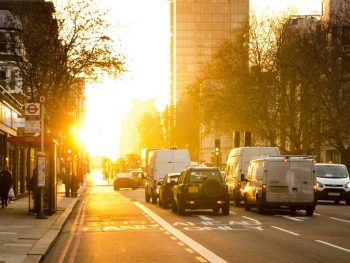
Traffic jams on UK roads rose significantly in 2024 – and extreme weather conditions were a major factor, according to TomTom.

The 14th edition of its annual Traffic Index reveals average congestion levels rose to 20.4%; a 9% year-on-year increase compared to 18.7% in 2023.
This rise in congestion is mirrored by a decline in average driving speeds across the country, falling from 37.3mph in 2023 to 36.7mph in 2024.
The research also reveals that 34 out of 35 (97% of) UK cities saw average congestion levels increase in 2024, with Southampton congestion levels increasing by more than 34% year on year.
London’s city centre remained the slowest city in the UK and in Europe to drive in, ranking fifth globally for travel time per mile. Drivers in the city took an average of 32:08 minutes to drive six miles, travelling at just 11.2mph (vs. 11.4mph in 2023).
Edinburgh’s city centre ranked second in the UK for slow travel time per mile (58th globally), with an average travel time of 26:27 minutes for a six-mile journey and an average speed of 13.6mph.
And Liverpool city centre was the third slowest with 24:22 minutes for a six-mile trip, at 14.8mph (vs. 15.2mph in 2023).
Ranking: The top 10 UK cities with the slowest travel times in 2024
| City | area (centre/metro) | World ranking (travel time) | 2024 Avg travel time per km | 2023 Avg travel time per km | Percentage difference with 2023 | 2024 Avg Speed (mph) | 2023 Avg Speed (mph) |
| London | City Centre | 5 | 32:08 | 31:34 | +1.8% | 11.2 | 11.4 |
| Edinburgh | City Centre | 58 | 26:27 | 26:05 | +1.4% | 13.6 | 13.8 |
| Liverpool | City Centre | 94 | 24:22 | 23:39 | +3.1% | 14.8 | 15.2 |
| Leicester | City Centre | 99 | 24:01 | 23:44 | +1.2% | 15 | 15.2 |
| Manchester | City Centre | 100 | 23:54 | 23:19 | +2.6% | 15 | 15.4 |
| Sheffield | City Centre | 107 | 23:05 | 22:48 | +1.3% | 15.6 | 15.8 |
| Glasgow | City Centre | 123 | 22:30 | 22:21 | +0.7% | 16 | 16.1 |
| Nottingham | City Centre | 127 | 22:17 | 21:43 | +2.7% | 16.2 | 16.6 |
| Bristol | City Centre | 133 | 22:01 | 21:48 | +1.0% | 16.3 | 16.5 |
| Hull | City Centre | 147 | 21:31 | 21:22 | +0.7% | 16.7 | 16.8 |
Hull, Belfast and Edinburgh are Britain’s most congested cities
Hull’s city centre had the highest average congestion level out of all UK cities, reaching an average congestion level of 46% (+3.6% YoY). Belfast was the second most congested city in the UK, with an average congestion level of 45%, a +10.5% YoY increase, while Edinburgh ranked third with an average congestion level of 40%, a +6.5% increase from 2023.
The cities that saw the highest growth in congestion levels when comparing 2024 to 2023 included Southampton (+34.4%), Liverpool (+13%), Stoke on Trent (+11.7%), Manchester (+11.5%) and Nottingham (+11.3%).
Ranking: Top 10 UK cities with the highest congestion levels
| City | area (centre/metro) | World ranking (congestion level) | 2024 Avg Congestion Level (24/7) (%) | 2023 Avg Congestion Level (24/7) (%) | Percentage difference with 2023 |
| Hull | City Centre | 12 | 46 | 45 | +3.6% |
| Belfast | City Centre | 15 | 45 | 41 | +10.5% |
| Edinburgh | City Centre | 49 | 40 | 37 | +6.5% |
| Leicester | City Centre | 51 | 39 | 37 | +4.8% |
| Sheffield | City Centre | 56 | 39 | 36 | +6.6% |
| Oxford | City Centre | 63 | 38 | 36 | +7.9% |
| Birmingham | City Centre | 66 | 38 | 36 | +7.6% |
| Southampton | City Centre | 68 | 38 | 28 | +34.4% |
| Aberdeen | City Centre | 73 | 37 | 37 | +1.4% |
| Exeter | City Centre | 79 | 37 | 34 | +7.0% |
Londoners lost 4.5 days in rush-hour traffic
For each city, TomTom also calculated the total time lost over the year due to congestion.

In 2024, the average London commuter lost an average of 109 hours stuck in traffic, when travelling through the city centre during peak hours (AM and PM) – the equivalent of 4,5 days or almost 15 working days.
In second place was Leicester, where rush-hour commuters lost an average of 97 hours stuck in traffic in 2024.
Meanwhile, Hull came in close third, with rush-hour drivers losing an average of 96 hours (four days) to congestion.
Ranking: Top 10 UK cities that lost the most time due to peak-hour congestion
| City | Area (centre/metro) | Hours lost due congestion (2024) | Hours lost due congestion (2023) | Percentage difference in time lost in congestion 2024 with 2023 | Time spent in driving at peak hours (2024) | Time spent in driving at peak hours (2023) | Difference in time spent in peak 2024 with 2023 |
| London | City Centre | 109 hrs | 106 hrs | +2,9% | 294 hrs | 291 hrs | +0,9% |
| Leicester | City Centre | 93 hrs | 92 hrs | +1,2% | 226 hrs | 225 hrs | +0,5% |
| Hull | City Centre | 93 hrs | 87 hrs | +6,3% | 205 hrs | 199 hrs | +2,8% |
| Manchester | City Centre | 91 hrs | 85 hrs | +7,6% | 229 hrs | 222 hrs | +3,1% |
| Edinburgh | City Centre | 91 hrs | 86 hrs | +5,6% | 235 hrs | 230 hrs | +2,0% |
| Sheffield | City Centre | 88 hrs | 84 hrs | +5,2% | 215 hrs | 210 hrs | +2,0% |
| Birmingham | City Centre | 86 hrs | 82 hrs | +5,1% | 198 hrs | 192 hrs | +2,8% |
| Belfast | City Centre | 85 hrs | 77 hrs | +10,7% | 188 hrs | 179 hrs | +4,8% |
| Bristol | City Centre | 84 hrs | 79 hrs | +6,5% | 209 hrs | 204 hrs | +2,6% |
| Liverpool | City Centre | 83 hrs | 76 hrs | +9,6% | 219 hrs | 211 hrs | +3,6% |
More commuters and bad weather create the perfect storm for disruption
The UK’s gridlock reflects commuter numbers getting back to pre-pandemic levels, limited road capacity, and a lack of viable public transport alternatives

But amid the Met Office’s warning for snow and ice this week, the latest TomTom data shows a clear link between the UK’s extreme weather conditions and rising traffic congestion levels.
TomTom identified the worst days for traffic congestion in the UK’s top 10 slowest cities, with London’s worst day falling on 27 November 2024. Infrastructure issues, including significant disruptions on the Elizabeth Line, forced commuters to seek alternative routes. The situation was worsened by heavy rainfall and flooding caused by Storm Conall, creating the perfect storm for travel chaos in the capital.
The UK’s second slowest city, Edinburgh, faced congestion spikes during last year’s storms. For instance, storms Isha and Jocelyn in January 2024 caused Edinburgh congestion peaks of 57% and 53% on consecutive days. This is significantly higher than the city average of 37%. These spikes, particularly during off-peak times and weekends, suggest Edinburgh’s infrastructure may be especially vulnerable to storm-related disruptions.
The data also reveals that 34 of 35 cities (Leicester being the exception) experienced their worst traffic days on Tuesday, Wednesday or Thursday – key commuting days for office workers.
Ranking: The worst day of 2024 in the top 10 UK cities
| City | Area (urban/metro) | Worst day: date | Worst day: congestion level (average day) | Worst day:
Time to travel 6 miles |
| London | City Centre | 27/11/2024 (Wednesday) | 48 | 36:13 |
| Edinburgh | City Centre | 23/05/2024 (Thursday) | 56 | 29:54 |
| Liverpool | City Centre | 16/01/2024 (Tuesday) | 66 | 30:04 |
| Leicester | City Centre | 01/10/2024 (Monday) | 59 | 27:43 |
| Manchester | City Centre | 26/11/2024 (Tuesday) | 62 | 29:23 |
| Sheffield | City Centre | 08/02/2024 | 93 | 32:27 |
| Glasgow | City Centre | 27/11/2024 | 49 | 25:41 |
| Nottingham | City Centre | 13/12/2023 | 59 | 26:17 |
| Bristol | City Centre | 28/11/2024 | 55 | 25:36 |
| Hull | City Centre | 19/01/2024 | 94 | 29:28 |
Andy Marchant, traffic expert at TomTom, said: “The 14th edition of the TomTom Traffic Index highlights the growing pressures on the UK’s road infrastructure and underlines the need for innovative solutions to address traffic flow challenges.
“Most UK cities continue to face rising travel times and lost hours due to traffic congestion. When UK Plc faces uncertain economic conditions, this places strain on commuters and local economies alike. Road mobility in urban areas is key to driving growth. Our findings demonstrate the urgent need for UK cities to innovate when it comes to traffic management, alternative mobility, and modern public transport to drive ahead.”
For more information and to see the full TomTom Traffic Index report, please visit www.tomtom.com/traffic-index/.

