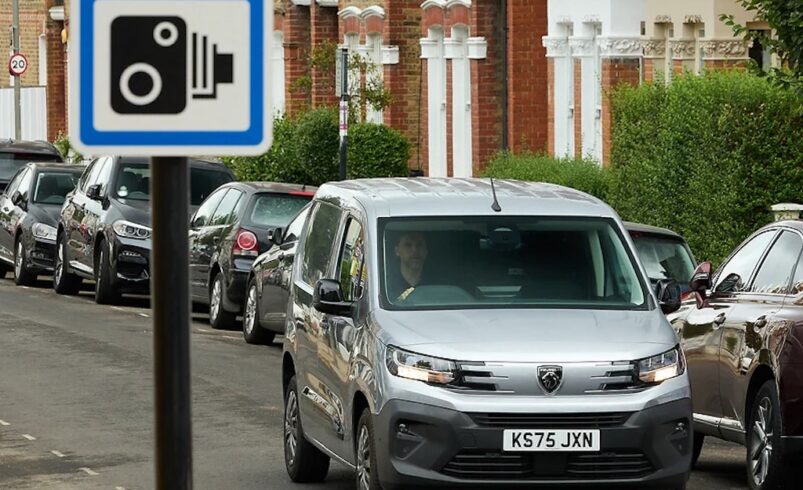
UK van drivers spend an average of £780 per year on fees and penalty charges for driving into Low Emission and Clean Air Zones, new research shows.
 The fees, which equate to around £65 per month, far outstrip the annual cost each of vehicle maintenance, insurance and parking fines.
The study, carried out by Peugeot, shows that London van drivers face the heaviest financial toll for driving into Low Emission and Clean Air Zones, paying an average of £99 per month (£1,200 per year). They are followed closely by drivers in the Tyneside Clean Air Zone (Newcastle and Gateshead), who shell out £82 monthly (£984 per year). Both regions enforce the highest daily entry fee of £12.50 for non-compliant vehicles, compared to the £8 to £10 fees levied for the Clean Air Zones operating in England.
There are currently 14 Low Emission Zones, Clean Air Zones or Zero Emission Zones across the UK, including the London ULEZ and LEZ. Nine of these zones charge non-compliant petrol and diesel vehicles an entry fee, with penalty charge notices issued to drivers who fail to pay the daily charge.
Conversely, Scotland’s zones – operating in Glasgow, Edinburgh, Dundee and Aberdeen – do not use a daily fee system. Instead, they completely ban non-compliant vehicles, issuing immediate penalty fines to any that enter the zones. Because of this enforcement difference, Scottish van drivers spend a lower average of £39 per month. Drivers in Wales, which currently has no active emission zones, pay the least at £37 per month.
The true cost of driving a van in the UK
Peugeot’s research highlights how Clean Air Zones (CAZs) and Low Emission Zones (LEZs) have quickly become one of the highest expenses for commercial drivers.
 The £780 annual average for zone fees now surpasses several traditional vehicle overheads. These include the £632 per year (c.£52 per month) that van drivers spend on parking and related fines on average.
Van drivers also spend more on Clean Air Zone charges than they do on servicing, repairs and MOTs, with maintenance costs coming to £715 per year on average. Insurance premiums are also lower, with an average cost of £626 per year.
But fuel is still the biggest expense, costing on average £176 per month (£2,112 a year).
The research also shows that food and drink when at work adds an average of just over £88 to commercial van drivers’ monthly expenditure (£1,061 per year).
Steve Wass, managing director, Peugeot UK, said: “With rising fuel and living costs, our research highlights how much commercial van drivers face in terms of annual expenditure. For those regularly driving into Clean Air Zones, the cost of running a non-compliant van can add up, proving there has never been a better time to switch to cleaner and more sustainable transportation.”
Clean Air Zones generate councils billions in revenue
The research by Peugeot also shows that councils are raking in huge revenues from Clean Air Zones.
 Data obtained through Freedom of Information requests shows that 12 of the 13 councils operating these zones have generated a combined revenue of nearly £1.5bn from launch up to 31 March 2026.
Unsurprisingly, London dominates this revenue. Together, the London Low Emission Zone (LEZ) and the Ultra Low Emission Zone (ULEZ) have racked up over £1.2bn since their respective launches. On 29 August, the London ULEZ expansion marks its third anniversary, following the expansion in 2023 from inner London to all 32 Greater London boroughs.
Outside of London, the Birmingham Clean Air Zone has generated the most revenue, pulling in over £188m.
Despite the major financial impacts, Peugeot’s research highlights a significant gap in driver awareness. While 66% of surveyed drivers believe their vehicle meets the necessary standards, 19% are entirely unsure if their van is compliant, leaving them highly vulnerable to accidental fines. Moreover, 15% were aware their van does not meet the emissions standards required to enter Low Emission and Clean Air Zones.
Average running costs for commercial van drivers
| Expense |
Cost per year |
| Fuel |
£2,112 |
| Food and drink while at work |
£1,061 |
| Low Emission / Clean Air Zone charges |
£780 |
| Van maintenance (servicing, repairs and MOTs) |
£715 |
| Parking and related fines |
£632 |
| Van insurance |
£626 |
Annual cost for van drivers entering Clean Air Zones in non-compliant vehicles on a daily basis
| UK City |
Daily fee for non-compliant private vans |
Estimated annual cost if using daily (based on a five-day working week) |
| Bath |
£9 |
£2,340 |
| Birmingham |
£8 |
£2,080 |
| Bradford |
£9 |
£2,340 |
| Bristol |
£9 |
£2,340 |
| London |
£12.50 |
£3,250 |
| Oxford |
£2-10 |
£520-£2,600 |
| Portsmouth |
£0 |
£0 |
| Sheffield |
£10 |
£2,600 |
| Tyneside |
£12.50 |
£3,250 |
| Aberdeen |
N/A – total ban on all non-compliant vehicles |
N/A – total ban on all non-compliant vehicles |
| Dundee |
N/A – total ban on all non-compliant vehicles |
N/A – total ban on all non-compliant vehicles |
| Edinburgh |
N/A – total ban on all non-compliant vehicles |
N/A – total ban on all non-compliant vehicles |
| Glasgow |
N/A – total ban on all non-compliant vehicles |
N/A – total ban on all non-compliant vehicles |
Income generated by UK Clean Air Zones
| Local Authority / Zone |
Time Period
|
Income from all non-compliant vehicles (daily fees and PCNs) |
| England |
| Birmingham Clean Air Zone |
01/06/2021 – 31/03/2026 |
£188,953,772.60
|
| Bradford Clean Air Zone |
26/09/22 – 31/03/2026 |
£28,103,282.00
|
| London Low Emission Zone |
01/04/17 – 31/03/2026 |
£90,668,570.00
|
| London Ultra Low Emission Zone |
08/04/19 – 31/03/2026
|
£1,128,136,876.00 |
| Oxford Zero Emission Zone |
28/02/22 – 31/03/2026
|
£3,930,569.23 |
| Portsmouth Clean Air Zone |
29/11/2021 – 31/03/2026
|
£2,010,758.00 |
| Sheffield Clean Air Zone |
27/02/2023 – 31/12/2025
|
£17,172,141.00 |
| Tyneside Clean Air Zone |
30/01/2023 – 31/03/2026 |
£10,287,813.95
|
| Total Income Generated |
£1,469,263,782.78
|
| Scotland |
| Aberdeen |
01/06/2024 – 31/03/2026
|
£1,602,695.32 |
| Dundee |
30/05/2024 – 31/03/2026
|
£636,611.91 |
| Edinburgh |
01/06/2024 – 31/03/2026
|
£2,298,520.04 |
| Glasgow |
01/06/2023 – 31/03/2026
|
£2,253,278.00 |
| Total Income Generated |
£4,537,827.27
|
| Total Income Generated (UK) |
£1,473,801,610.05 |